
 Steps to Create Heat Map in OBIEE
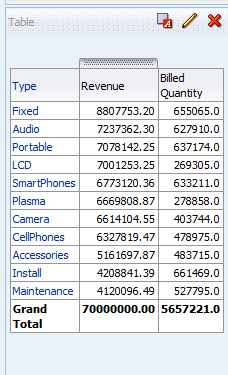
 Step : Create the subject area with dimension and fact columns as shown below

Step 2: Add the Narrative scripts as shown below
Prefix:
<script type="text/javascript" src="https://www.google.com/jsapi"></script>
<script type="text/javascript">
if(document.URL.indexOf("saw.dll?Answers") == -1) {
google.load("visualization", "1", {packages:["treemap"]});
google.setOnLoadCallback(drawHMChart);
}
function drawHMChart() {
if(document.URL.indexOf("saw.dll?Answers") == -1) {
// Create and populate the data table.
var data = new google.visualization.DataTable();
data.addColumn('string', 'Region');
data.addColumn('string', 'Parent');
data.addColumn('number', 'Revenue');
data.addColumn('number', 'Quantity');
myHMArray=[];
myHMArray.push(["All Brands",null,0,0]);
}
Narrative :
myHMArray.push(["@1","All Brands",@2,@3]);
Postfix:
if(document.URL.indexOf("saw.dll?Answers") == -1) {
data.addRows(myHMArray);
// Create and draw the visualization.
var tree = new google.visualization.TreeMap(document.getElementById('div_Heatmap'));
tree.draw(data, {
minColor: '#f00',
midColor: '#ddd',
maxColor: '#0d0',
headerHeight: 15,
fontColor: 'black',
showScale: true});
}
}
</script>
<b>Note: Revenue represented by size and Billed quantity represented by color</b>
<div id="div_Heatmap" style="width: 900px; height: 500px;"></div>
Step 3: Results as shown below

Thanks,
Sandeep
4 comments:
This is very important news about Oracle Business Intelligence. who wish to know more about Business intelligence please contact with their administrator. please continue to keep on.
Oracle Business Intelligence
Hi,
I have a requirement to add custom image in charts/graphs instead of defaults(triangle,diamond,circle etc)..Please.
Thanks,
When I use above script, it is displaying the blank screen for me, Pleas suggest what to do
Hello.
I've the same problem.
You can press F5 to refresh your screen and the Heat Map is Show.
Post a Comment